Interactive map shows how vulnerable your neighborhood is to disaster
By Alix Martichoux
Published on April 26, 2026.
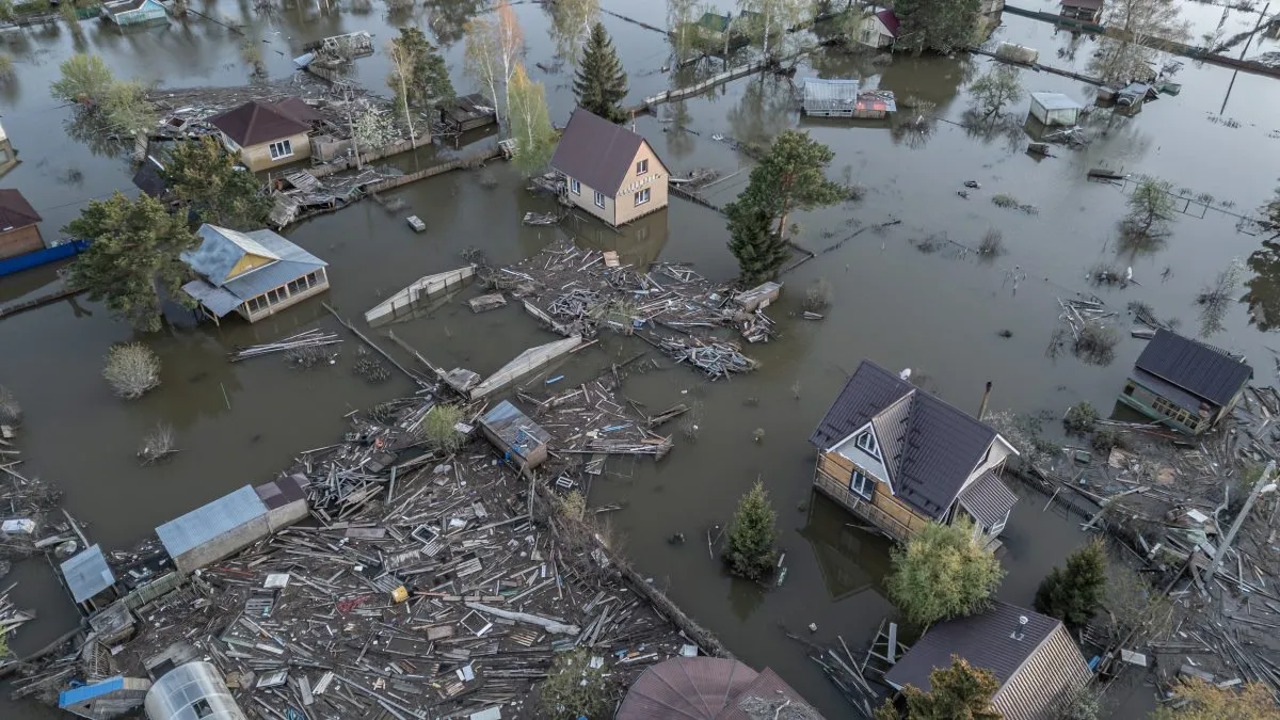
The U.S. Census Bureau has released an interactive map showing the threat level in every census tract in relation to natural disasters such as earthquakes, fires, floods, severe storms. The map measures what percentage of the local population is considered “socially vulnerable” to a disaster, particularly if high poverty levels, crowded housing, a large elderly population, difficult vehicle access or large communication barriers are present. The largest source of risk in many areas is earthquakes, though some are vulnerable to wildfires. The Federal Emergency Management Agency (FEMA) recommends making a plan for a natural disaster, which includes evacuation routes, emergency supplies, and a basic disaster kit.
Related Articles

Trump recounts political unity after White House Correspondents’ Dinner shooting: ‘Place was just coming together’
President Trump praised the unity among Democrats after a shooting at the White House, highlighting the need for unity to avoid backlash.

Trump calls journalist to check in after White House Correspondents' Dinner shooting
President Donald Trump called ABC's Jonathan Karl to check on his safety after the White House Correspondents' Dinner was attacked by a gunman.

The Reality of Fiji
Fijian director Tulia Nacola discovered filmmaking through her experiences on reality TV, teaching her to master the art and design of setwork.